Mapbox GL JS is a JavaScript library that uses WebGL to create interactive maps. Layers are built with vector tiles and Mapbox styles. Rendering runs with WebGL so it is fast, even with a ton of data.
I decided to start exploring Mapbox GL JS (I'm going to call it mapgoxgl from now on) over the last week for a project at work. I'm currently using Leaflet because of the Vue2-Leaflet library that integrates nicely with Vue. There are a few mapboxgl libraries for Vue, all at various stages of development. My favorite thing about the Vue2-Leaflet package is that it is very easy to interact with the Leaflet map using the $L binding. Going this route means using the methods defined in the Leaflet documentation.
My knowledge of mapboxgl isn't as good as Leaflet. So I decided to get a hang of the library and build some cool stuff!
Note: this post is a stream of conciousness dump as I figure out some GIS stuff for the web, and a little vanilla JS along the way. Expect random updates.
Create a super simple sandbox
Let's create a sandbox to further explore the features of mapboxgl. Clone this repo to get started. Then cd into the directory, run npm install (or yarn) the packages. Finally, npm run start to start the dev server.
I'm using ParcelJS as a bundler and dev server. Beware, there are a few tricky bugs associated with the mapboxgl library and how Parcel transpiles node modules in the directory. I've gotten around them by only supporting recent browsers. An easy decision since I am not going to be deploying this sandbox.
Note that there are several branches in this git repo. This helps me refer back to earlier steps along the way when I come back to the code. If you're just starting out I recommend switching to the basic-setup branch
Our first map
Creating a map is pretty easy. A single html file will work.
<html>
<head>
  <script src='https://api.tiles.mapbox.com/mapbox-gl-js/v1.0.0/mapbox-gl.js'></script>
  <link href='https://api.tiles.mapbox.com/mapbox-gl-js/v1.0.0/mapbox-gl.css' rel='stylesheet' />

  <style>
    /* set the style for a full screen map */
    html,
    body {
      height: 100%;
      margin: 0;
    }

    #map {
      height: 100vh;
    }
  </style>
</head>

<body>

  <div>
    <div></div>
    <div id="map"></div>
  </div>

  <script>
    mapboxgl.accessToken = 'your mapbox token'
    var map = new mapboxgl.Map({
      container: 'map',
      style: 'mapbox://styles/mapbox/outdoors-v10',
      center: [-116.77592011899117, 38.64954285997146],
      zoom: 6
    })
  </script>

</body>
</html>
I've setup the project to split out the CSS, HTML, and JavaScript in their own files. The gist is that the main.css file contians similar CSS as above. index.html has the HTML portion. And index.js has the script portion. The snippet above is nice because you can copy that into an HTML file and get started.
The repo setup
Here are the files individually.
<!-- index.html -->
<html>
  <head>
    <link rel="stylesheet" type="text/css" href="main.css">
  </head>
  <body>
    <div id="map"></div>
    <script src="./index.js"></script>
  </body>
</html>
Nothing super interesting here. I'm not referencing the mapboxgl JavaScript or css in the head because I'll import that in the JavaScript file.
// index.js
const mapboxgl = require('mapbox-gl')
import 'mapbox-gl/dist/mapbox-gl.css'

mapboxgl.accessToken = process.env.MAPBOX_KEY

const map = new mapboxgl.Map({
  container: 'map',
  style: 'mapbox://styles/mapbox/streets-v11',
  center: [-116.77592011899117, 38.64954285997146],
  zoom: 6
})

const nav = new mapboxgl.NavigationControl()
const scale = new mapboxgl.ScaleControl({
  unit: 'imperial'
})
const fullscreen = new mapboxgl.FullscreenControl()

map.addControl(nav, 'top-left')
map.addControl(scale, 'bottom-left')
map.addControl(fullscreen, 'top-left')
Parcel provides a few nice utilities (all by default) to import CSS styles and dotenv. I'm importing the mapboxgl JavaScript and CSS here. I probably could have used import mapboxgl from 'mapbox' but I didn't .
I'm using a .env file to read my mapbox API key and insert it into this file. All that is needed is the following in the file: MAPBOX_KEY=yourreallylongaccesskeygoesherejustlikethis
Finally, the CSS. Again nothing too special. I've started it out with a simple CSS reset.
/* main.css */
html {
  box-sizing: border-box;
  font-size: 16px;
}

*, *:before, *:after {
  box-sizing: inherit;
}

body, h1, h2, h3, h4, h5, h6, p, ol, ul {
  margin: 0;
  padding: 0;
  font-weight: normal;
}

ol, ul {
  list-style: none;
}

img {
  max-width: 100%;
  height: auto;
}

#map {
  height: 100vh;
  width: 100vw;
  background-color: springgreen;
}
Once all these files are in place run npx parcel index.js (add this to the start script in the package.json, then run with npm run start). Hopefull you'll get something that looks like this.
Go ahead an play around with that map.
And now the fun (frustration) begins
The mapboxgl library seems huge. Not only is it the JavaScript library, but their styles that you have to learn. Each class in the library has tons of methods, or events, etc. It is a comprehensive mapping library after all. I've hit many stumbling blocks along the way.
My biggest advice moving forward is to read the documentation. Don't just look at the examples and copy the code. And when trying the examples actually type the code in, don't copy and paste.
Mouse coordinates
I like to know where my mouse is when hovering over a map. It might not be super userful, but it's a fun experiment. You can look at the mouse-coords branch to see how that is done. The biggest takeaway is to use the map.on listener/method (I don't know what it is... TODO for me I guess) to respond to mousemove events.
// index.js
// ... other code
map.on('mousemove', (e) => {
  const { lng, lat } = e.lngLat

  document.getElementById('long').innerHTML = Math.round(lng * 10000) / 10000
  document.getElementById('lat').innerHTML = Math.round(lat * 10000) / 10000
})
Now everytime the mouse moves an event fires with the coordinates of the mouse in the e.lngLat property. Then set the longitude and latitude of some DOM element. I've rounded the values to the nearest thousandths place as that is something we frequently do at work.
This example is pretty much directly from the documentation.
Toggle layers
Another feature of web maps is the ability to toggle layers on and off. This is very common in desktop GIS system, as well as many web maps (GAIA GPS, CalTopo, OnX). Getting a single layer to toggle on and off is pretty straight forward (and straight from the documentation). Check the layer-toggle branch for more details.
I suppose the biggest pain is trying to do this with vanilla JavaScript. I'll admit I'm one of those people that jumped straight into a framework without a great understanding of vanilla JavaScript. Or, at least not working with the DOM. My JavaScript knowledge came from working with Node building a few APIs.
Serve Mapbox Vector Tiles from PostGIS
Tobin Bradley (twitter) created an awesome spatial websever that interfaces with a PostGIS database, dirt-simple-postgis-http-api. Its simplicity is beautiful. It's built with Fastify, the responses are gzipped. It is really fast! And it serves mapbox vector tiles.
I've cloned the repo and connected it to a PostGIS enabled PostgreSQL database called spatial-data. I've loaded these geopackages into the database with the ogr2ogr command.
# example usage
ogr2ogr -f PostgreSQL PG:dbname=<database name> <input file>

# a real example
ogr2ogr -f PostgreSQL PG:dbname=spatial-data nv-counties.gpkg
Note: I'm working on a Mac and installed postgres, postgis, gdal, geos, proj, etc. with homebrew. The OSGEO fols maintain a homebrew repo for development versions of all these packages. I installed all mine with brew install <formula>. If you're working on a Windows, I'm so sorry. I have very litte experience installing things like this on Windows. Maybe try using the Windows Subsytem for Linus.
Playing with PostGIS is a lot of fun. If you're ever curious about a function google the name of that function. Odds are you'll end up at the documentation for that function.
Anyway, once you have some data in the database, connect the the dirt-simple-postgis-http-api to the database by changing the connection details in the ./config/index.json file to match your database details. Then, npm run start will get the server up and running. Navigate to http://localhost:4000 to get a Swagger UI documentation site for the API (this is a super cool feature, thanks for including this Tobin). You'll see all the routes available for the API, as well as parameters and query string details for each route. For now, we are most interested in v1/mvt/..., and v1/list_layers. The former will return Mapbox Vector Tiles straight from the database! Plug these directly into the map.addSource function call to display them on a map.
Dynamic layer toggles
Now, we can fetch all the layers from the database and add a dynamic layer toggle list to the application. I'm pretty new to building vanilla JS projects. Like I said earlier. I have a basic knowledge of server side JS; front-end JS skills ellude me.
I created a function to fetch the all the layers from the API at js/api.js. See the function below.
export async function getLayers () {
  const res = await fetch('http://localhost:4000/v1/list_layers')
  return res.json()
}
Pretty simple for now. It might be a good idea to include the API URL in the .env file so it can be overwritten if need with environmental variables when deploying to production. Just a thought.
Now, a function to create a dynamic list of the layers in the database at js/layer-toggles.js
import { getLayers } from './api'

export async function createLayerToggles (map) {
  const layers = await getLayers()
  const parent = document.getElementById('layer-toggles')

  // loop over each layer and create inputs
  layers.forEach(layer => {
    const layerName = layer.f_table_name

    // create child elements
    const toggle = document.createElement('li')

    // create label
    const label = document.createElement('label')
    label.setAttribute('for', layerName)
    label.innerHTML = layerName.split('_').join(' ')
    label.style = 'text-transform: capitalize;'

    // create input
    const input = document.createElement('input')
    input.setAttribute('id', layerName)
    input.setAttribute('type', 'checkbox')
    input.setAttribute('name', 'layertoggle')
    input.setAttribute('value', layerName)

    // add event
    input.onclick = function (e) {
      const checked = this.checked

      if (checked) {
        map.setLayoutProperty(layerName, 'visibility', 'visible')
      } else {
        map.setLayoutProperty(layerName, 'visibility', 'none')
      }
    }

    toggle.append(input)
    toggle.append(label)
    parent.append(toggle)
  })
}
This all looks quite complicated! It took me awhile to reason about it too. Here is a breakdown of all the steps.
- first fetch the list of layers from the database
- Loop over each layer in the list
- create a toggle
<li>element - create a checkbox
<input>element - create a
<label>for the checkbox - set the appropriate attributes to each of these elements we've created.
- add an onclick event to each input that will toggle the visibility of the layer
- append the input and label to the toggle
- then append the toggle to the parent element
Check the repo for a complete picture of the setup for this project. With a little luck you should get an app that looks a little like this:
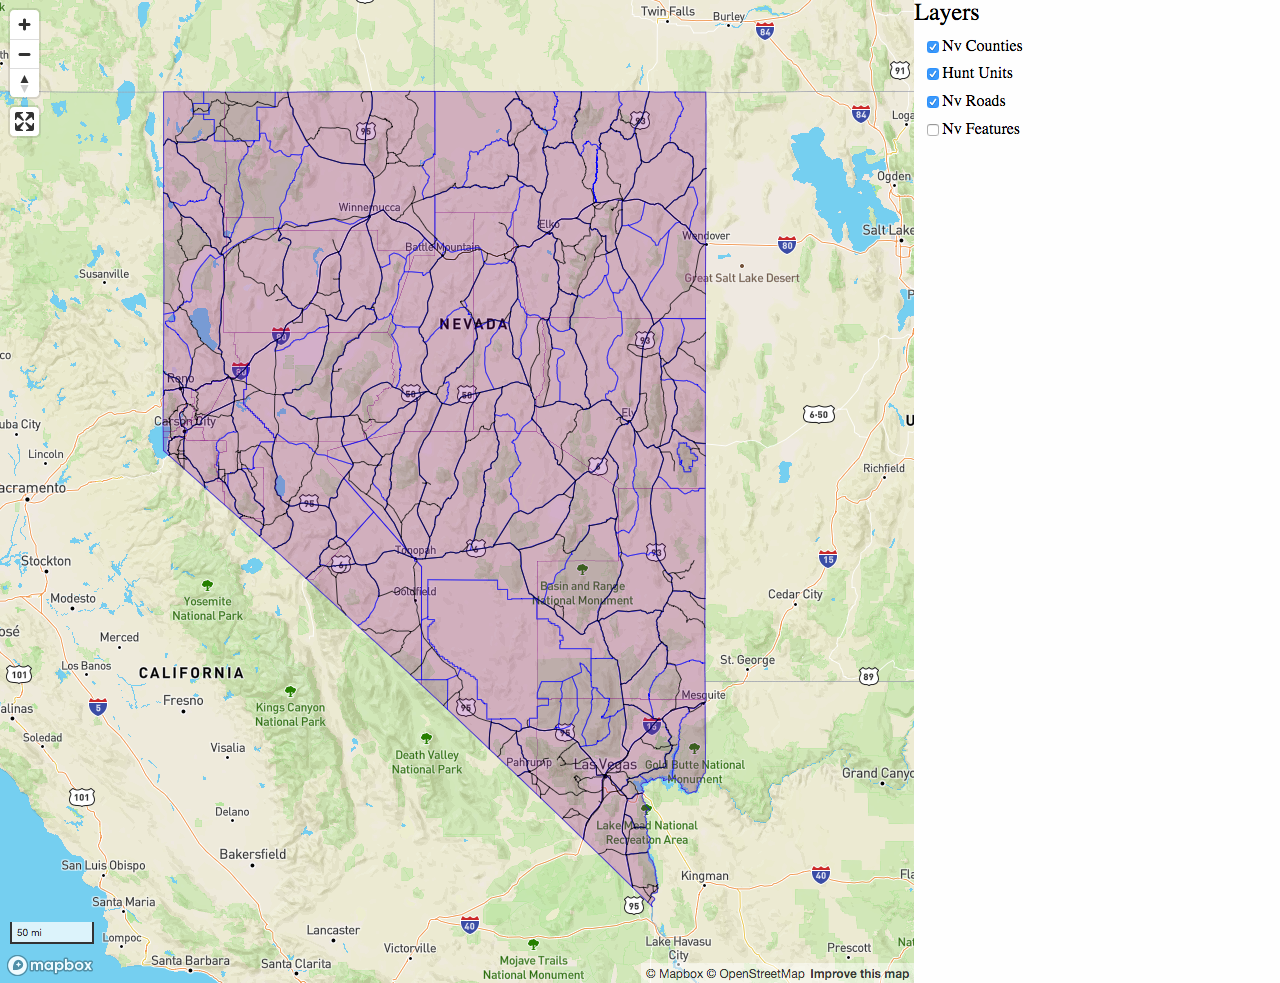
Yeah, it's pretty ugly right now! I'm working on rounding out some of the functionality before I get too carried away with styling the dang thin.
Wrap up
A few more interesting feature ideas to work on
Turn multiple layers on and off: updated 2020-06-22- Alter the opacity of layers when there are many layers loaded
- Style points based on attribute data
- Draw on the map
- The possibilities are endless
Ultimately, I'm working on rounding out my knowledge of mapboxgl, and vanilla JavaScript, before applying all that knowledge within a framework like Vue (or Svelte. Svelte seems awesome). Needless to say there is a lot to learn!