I think one of the biggest obstacles for moving R for all spatial data analysis is the lack of interactive maps, and basemaps. ArcMap makes this pretty easy. By default the map is dynamic, with a few clicks it is possible to add a basemap from ESRI. What if I told you it was just as easy to do that in R?
Leaflet is an open source JavaScript library for interactive maps. I've written a few posts about getting started with leaflet (here, and here). The Leaflet packages for R is a wrapper for much of the functionality provided by LeafletJS.
In the last few posts we've familiarized ourselves with sf. sf objects and leaflet play very nicely with each other.
A runnable copy of the script and data needed to follow along with this post can be found on GitHub
Leaflet basics
Create a leaflet map with these basic steps:
- create a map widget with
leaflet() - add basemaps with
addTiles() - add
sfobjects withaddMarker, etc. - repeat step 3
Remember to install leaflet, magrittr, and sf before getting started.
# install.packages(c('leaflet', 'magrittr', 'sf'))
library(leaflet)
library(magrittr)
library(sf)

leaflet() %>%
  addTiles()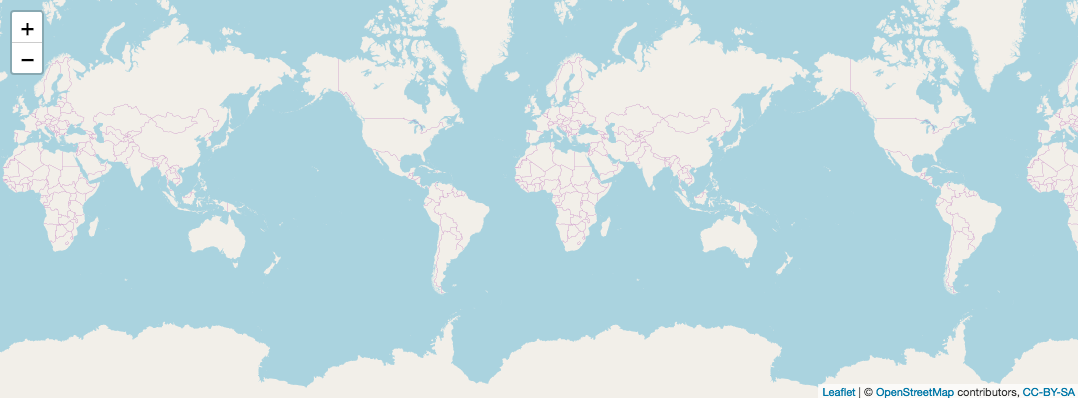
Granted this isn't a very useful map, but it is a great starting point. From here we can use several different basemaps. instead of the default Open Street Maps basemap. You can preview many of the basemaps at the leaflet provider demo website.
# use the Stamen Terrain basemap
leaflet() %>%
  addProviderTiles(leaflet::providers$Stamen.Terrain)

# use the ESRI world topo basemap
leaflet() %>%
  addProviderTiles(leaflet::providers$Esri.WorldTopoMap)
Adding markers
The simplest data we might want to display on a map are point data. There are several options for displaying markers, however the "default" method in leaflet are markers. For this example we will use a dataset of fast food chain locations. You can download this dataset from here.
# download the data, then read in the shapefile with sf
dat <- read_sf('Fast_Food_Chain_Restaurants/Fast_Food_Chain_Restaurants.shp')

## plot the first 10 restaurants
leaflet(dat[1:10, ]) %>%
  addTiles() %>%
  addMarkers()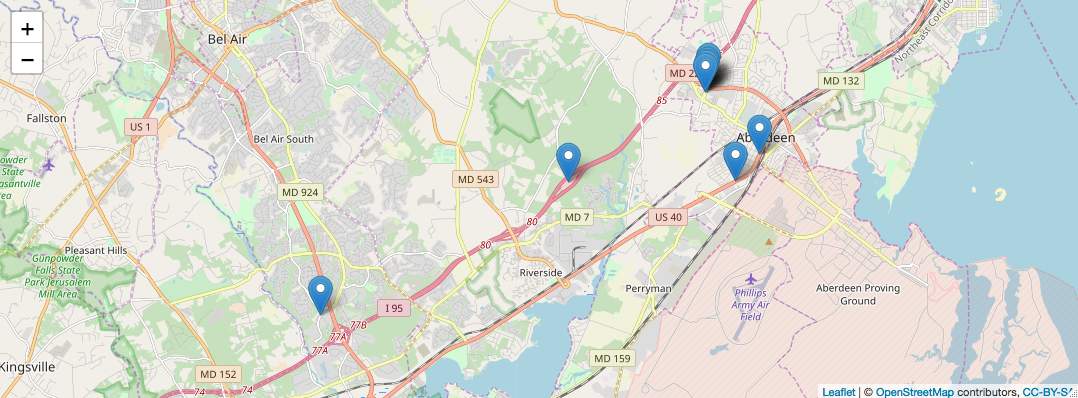
Add popups
We can also add popups or tooltips to the markers so that we can get more information when hovering or clicking on a marker.
## add popups
leaflet(dat[1:10, ]) %>%
  addTiles() %>%
  addMarkers(popup = ~htmltools::htmlEscape(Name))

## add tooltips on hover (labels)
leaflet(dat[1:10, ]) %>%
  addTiles() %>%
  addMarkers(label = ~htmltools::htmlEscape(Name))
The htmltools::htmlEscape call is used to sanatize data, a good practice. You can use the paste function or glue package to create a more complex popup.
Circle markers
I find that the default markers can be too busy when plotting many points. Our restaurant dataset has 1,783 rows, all from Maryland. That will get pretty crowded! I generally plot points as circle markers.
leaflet(dat) %>%
  addTiles() %>%
  addCircleMarkers(
    radius = 7, stroke = F, fillOpacity = .5,
    popup = ~htmltools::htmlEscape(Name)
  )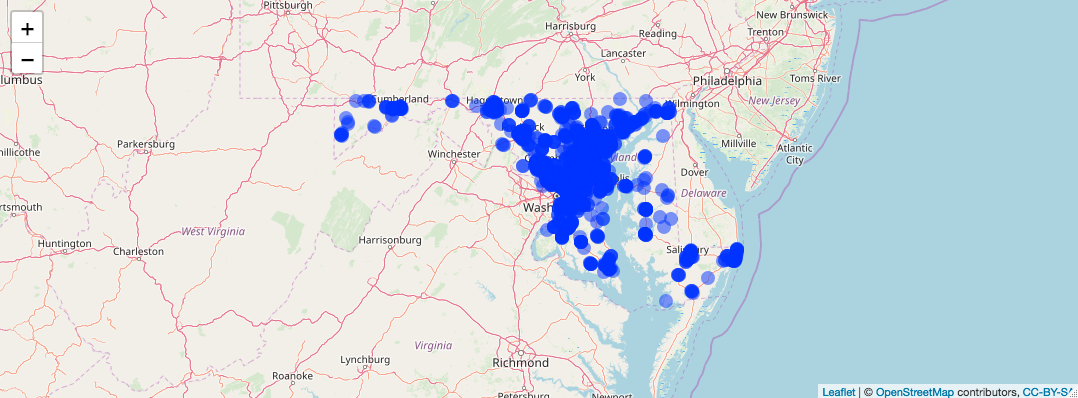
There is still a lot of over plotting, but it isn't as bad as the default markers would be. Go ahead and see for yourself. Replace the addCircleMarkers with addMarkers.
Color palettes
Finally, we can add color palettes to the points. This might look familiar to creating color palettes to plot in base R. It took a little getting used to for me comming from ggplot.
## filter data for simplicity
filtered_dat <- dat[dat$Name %in% c('Burger King', 'McDonald\'s', 'Taco Bell'), ]

## create color palette
pal <- colorFactor(c('Red', 'Yellow', 'Purple'), domain = c('Burger King', 'McDonald\'s', 'Taco Bell'))

## map it
leaflet(filtered_dat) %>%
  addTiles() %>%
  addCircleMarkers(
    radius = 7, stroke = F, fillOpacity = .5,
    color = ~pal(Name),
    popup = ~htmltools::htmlEscape(Name)
  )
You can check the markers to make sure the colors worked properly by clicking on them.
Wrap up
Yes, this might be a little more work than using ArcMap, but you're probably doing all your analysis in R anyway. Might as well type a few lines of code and get a map. If you're data is alread an sf or sp object it is pretty easy to create a map. Leaflet also has marker types for lines and polygons. Even rasters.
I will warn you though, some mapping operations can take a bit of time. A good open source alternative to ArcMap to look into is QGIS. It a full featured desktop GIS system. Probably R and Leaflet's biggest downside is cartography. The customizations possible in a desktop GIS suite are hard to beat. But it isn't impossible with R. I'll leave you with this final map.
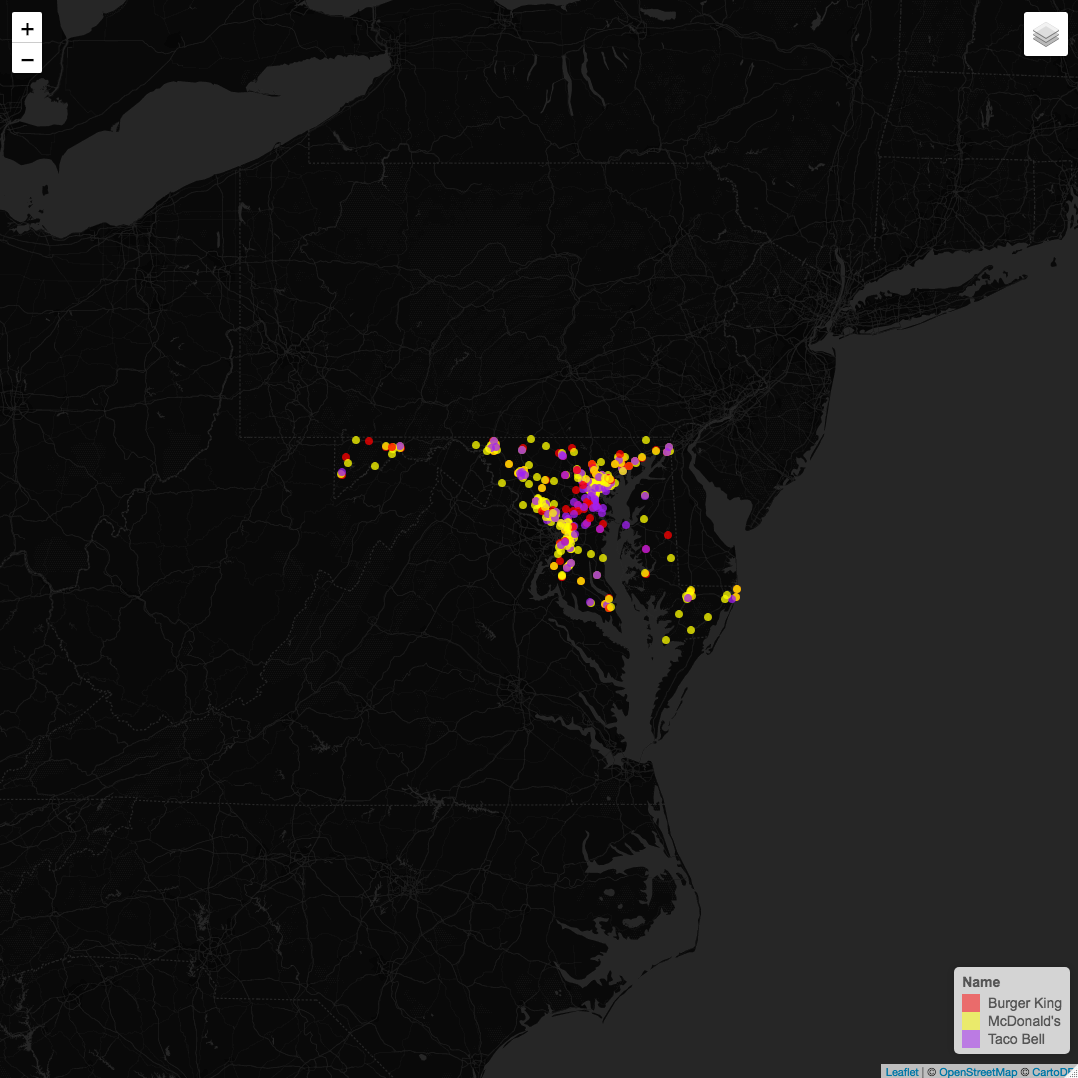
leaflet(filtered_dat) %>%
  addProviderTiles(providers$CartoDB.DarkMatterNoLabels, group = 'Dark Mode') %>%
  addProviderTiles(providers$CartoDB.PositronNoLabels, group = 'Light Mode') %>%
  addCircleMarkers(
    radius = 4, stroke = F, fillOpacity = .75,
    color = ~pal(Name),
    popup = ~htmltools::htmlEscape(Name)
  ) %>%
  addLegend(pal = pal, values = ~Name, position = 'bottomright') %>%
  addLayersControl(
    baseGroups = c('Dark Mode', 'Light Mode')
  )